
In this tutorial you will learn the installation process of Grafana on Ubuntu 22.04. Grafana is renowned for its versatility and powerful data visualization capabilities. It has become an essential tool for monitoring and analyzing data across various industries and applications. Whether you’re a seasoned systems administrator or a curious enthusiast eager to use the potential of Grafana for your data driven needs, this guide will provide you with clear instructions to set up Grafana on your Ubuntu 22.04 system. Let’s dive in and unleash the potential of Grafana for your data visualization and monitoring endeavors.
Install Prerequisite Packages
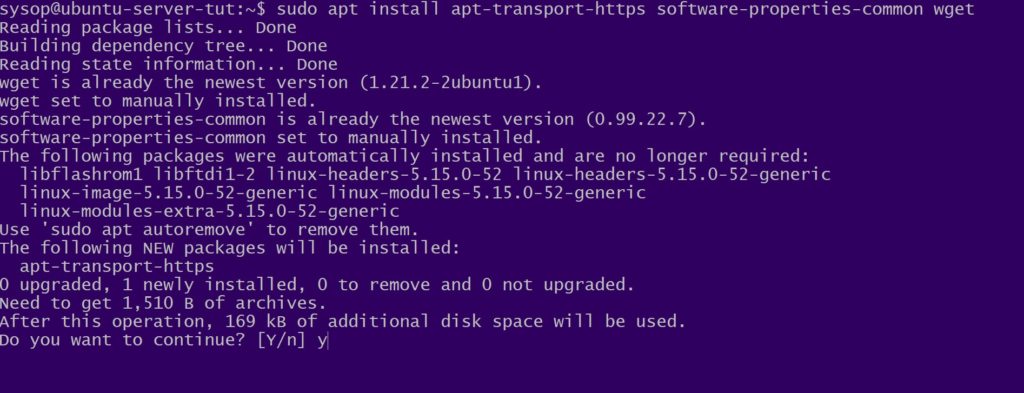
The first step for installing Grafana is to download and install all of the prerequisite packages. Install them using the apt command below.
sudo apt install apt-transport-https software-properties-common wgetImport Grafana GPG Key
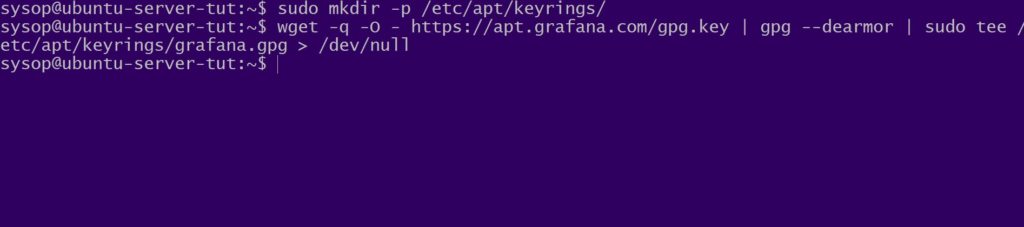
Next we need to import Grafanas repository GPG key. First create a keyrings folder with the mkdir command. Then download the key with the wget command.
sudo mkdir -p /etc/apt/keyrings/

wget -q -O - https://apt.grafana.com/gpg.key | gpg --dearmor | sudo tee /etc/apt/keyrings/grafana.gpg > /dev/null
Add The Grafana Repository
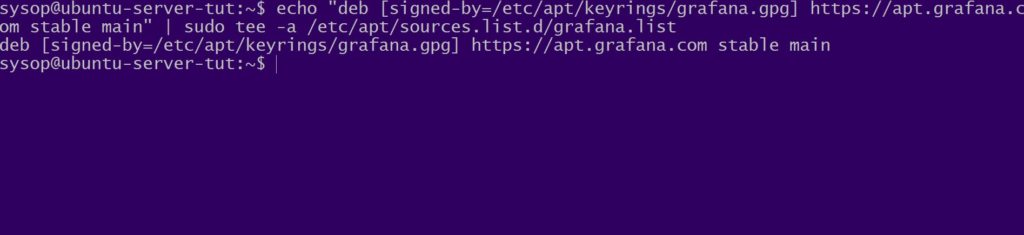
Now we will add the stable Grafana repository. Use the echo command to add it to your sources.list file.
echo "deb [signed-by=/etc/apt/keyrings/grafana.gpg] https://apt.grafana.com stable main" | sudo tee -a /etc/apt/sources.list.d/grafana.list
Update Ubuntu 22.04
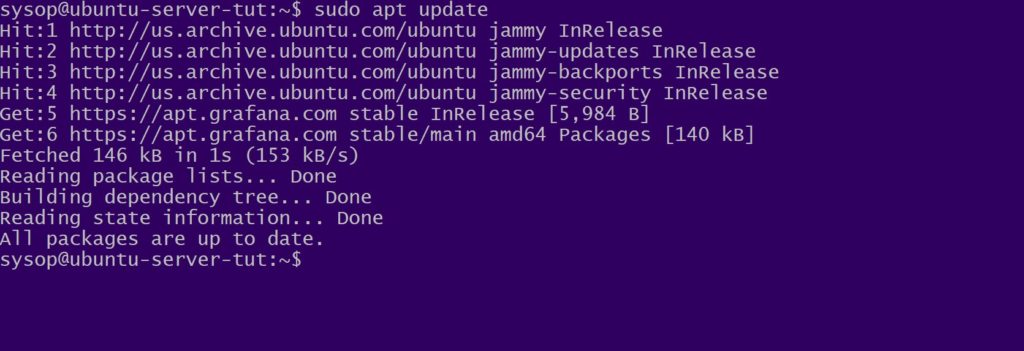
Afterwards we will use apt to update Ubuntu 22.04.
sudo apt update
Start and Enable Grafana Service
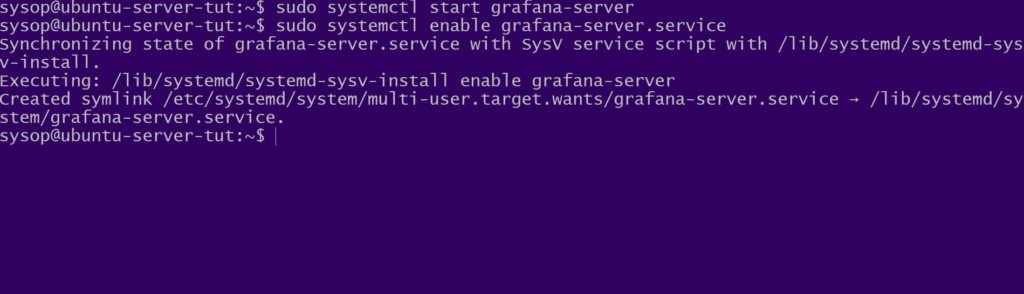
Next we will start and enable the grafana-server package. Use the systemctl start and enable commands to complete this step.
sudo systemctl start grafana-server

sudo systemctl enable grafana-server.service
Test Grafana Login
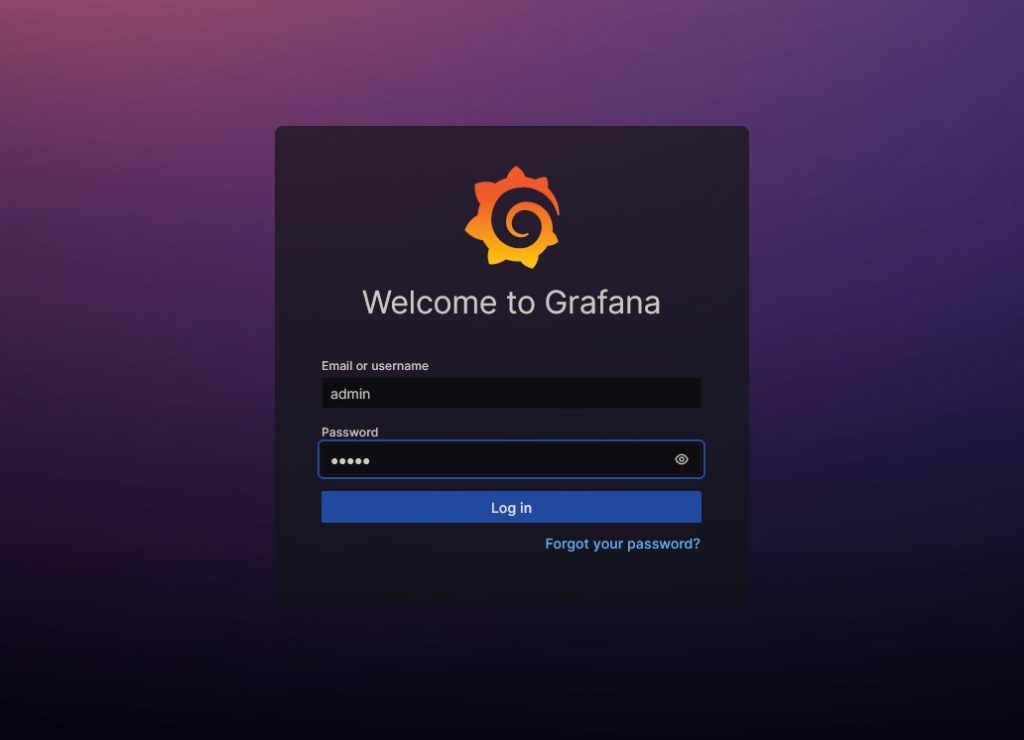
Navigate to the login page of your new Grafana installation by navigating to http://SERVER-IPADDRESS:3000 . Replace SERVER-IPADDRESS with the IP address of the server you installed Grafana onto. Then login using the default credentials below.
Username: admin
Password: admin
Start Using Grafana
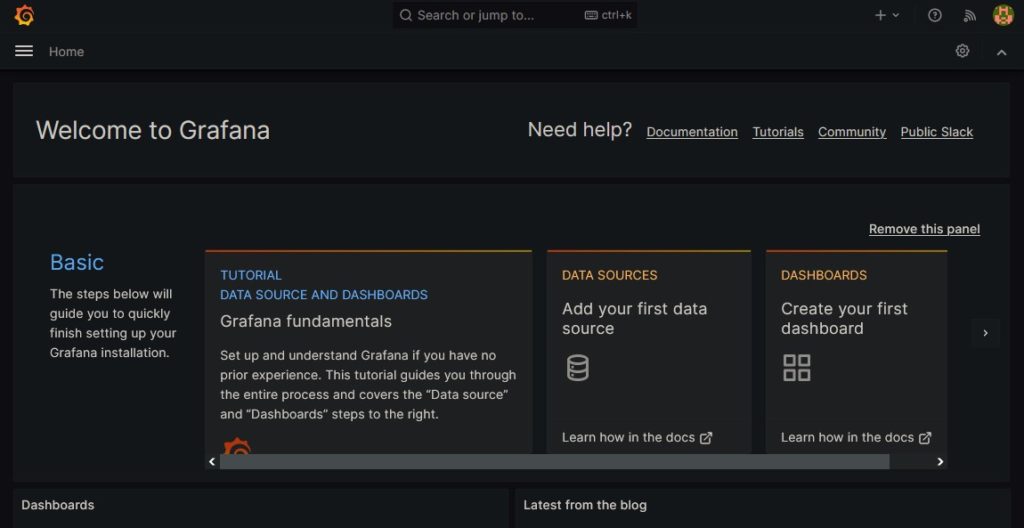
Once you login you have successfully installed Grafana on Ubuntu 22.04. You can now create a dashboard and get started with Grafana. For more information on getting started see the Grafana Build Your First Dashboard article.
FAQ
What is Grafana, and what is its primary purpose?
Answer: Grafana is an open source platform for monitoring data. Its primary purpose is to visualize and analyze data from different sources, including databases, cloud services, and monitoring systems. This help users gain insights into the performance of their applications and infrastructure.
What data sources can Grafana connect to?
Answer: Grafana can connect to a wide range of data sources, including but not limited to:
- Time series databases like InfluxDB, Prometheus, and Graphite.
- Relational databases such as MySQL, PostgreSQL, and Microsoft SQL Server.
- Cloud monitoring services like AWS CloudWatch and Azure Monitor.
- Log management systems like Elasticsearch and Loki.
- Custom APIs through HTTP requests.
- Many other data sources through community-supported plugins and integrations.
How can I create dashboards in Grafana?
Answer: Dashboards in Grafana are created using the web based interface. Here are the general steps:
- Log in to your Grafana instance.
- Click on “Create” and then “Dashboard.”
- Add a panel to your dashboard.
- Configure the panel’s data source, query, and visualization options.
- Customize the panel’s appearance and layout.
- Add more panels as needed to build a complete dashboard.
- Save the dashboard for future use and sharing.
Can Grafana be used for alerting and notifications?
Answer: Yes, Grafana includes alerting and notification features. You can set up alerts based on various thresholds or conditions in your data. When an alert condition is met Grafana can send notifications via various channel, such as email, Slack, PagerDuty, or custom webhooks, helping you to monitor and respond to issues.
Is Grafana suitable for large-scale enterprise environments?
Answer: Yes, Grafana is suitable for both small scale and large scale environments. It is highly scalable and can handle large volumes of data and users. Additionally Grafana supports features like user authentication, access control, and integration with various authentication providers. This makes it a great choice for use in enterprise level environments where security and access control are important considerations.
Questions?
If you have any questions or comments feel free to leave them below.
Related Resources
View our 5 Reasons to Switch from Windows 10 to Linux.
Learn How to Install Ubuntu Server 22.04 [Step by Step].
Check out our How to Easily Create a Bootable Linux USB Drive using Rufus article.
View our How to Setup an SFTP Server on Ubuntu 22.04 using OpenSSH tutorial.
Learn more cool things in Windows with our Linux Tutorials.
View all of our available online tools and converters at Formatswap.com.